Recipe: 3D-grid segmentation to evaluate 3D scanning#
A careful reading of Segmentation camera is recommended before diving into this advanced section.
The goal of this section is to show how to use the 3D-grid mode to evaluate the coverage achieved by the drone over a given area, such as a building.
Prepare the stencil file#
Obviously, the 3D-grid mode must be activated. Optionally, the size of the grid unit (in centimeter) can be specified.
The stencil file also requires an Objects map containing the object(s)
that will be scanned by the drone, the field Value needing to be
set to any stencil value between 1 and 255.
Example:
3DGridEnabled: true
3DGridBlockSize: 100
AssignRandomStencilValues: false
OverrideExisting: false

Objects:
  - Name: Building_C_VarA_C_2
    Value: 1
Make the drone scan a targeted area#
Parrot Sphinx is ready to be launched with the prepared stencil file and with a drone including at least one segmentation camera - which is the case for ANAFI Ai.
$ sphinx <path/to/anafi_ai.drone>::with_front_cam=1::firmware=<path/to/ext2.zip> &
$ parrot-ue4-<app> -stencil-file=<path/to/input.stencil>
In this example, ANAFI Ai is used to take photos of the targeted area with the
front_photo camera.
To have segmentation images taken at the same time as the photos
from front_photo camera, the front_segmentation_cam needs to be
configured in sync_over mode. Besides, the segmentation images also need
to be recorded and saved into a directory chosen by the user:
$ sphinx-cli param camera/front_segmentation_cam sync_over "front_photo"
$ sphinx-cli param camera/front_segmentation_cam recording/path <output_directory>
$ sphinx-cli param camera/front_segmentation_cam recording/enable "1"
At this point, the simulated drone is ready to take off and take photos of the targeted area using any method available (flightplan with GPS-lapse, manual piloting with time-lapse, etc).
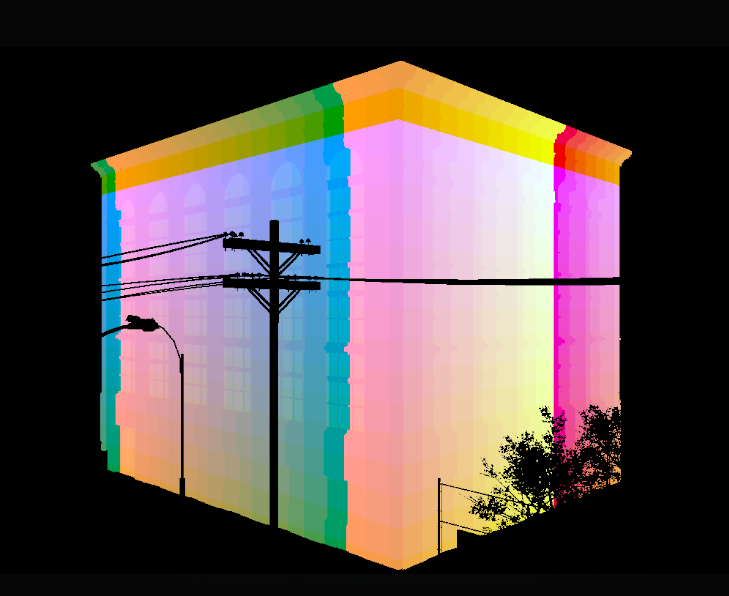
The segmentation image below shows how the building is cut into grid units. Note that the contrast has been artificially boosted to distinguish one unit from the others.
Once the flight around the area is terminated, Parrot Sphinx can be stopped. The segmentation images should have been collected into the specified <output_directory>.
Analyze the results#
The main idea is to extract from the recorded segmentation images all the RGBA colors that have been captured, given the fact that:
One single RGBA color represents a single unit of the 3D grid.
It is possible to generate the list of the colors that are expected to be captured for the objects specified in the stencil file:
parrot-ue4-<app> -stencil-file=<input.stencil> -write-3Dgrid-colors=<output.colors>
This way, it becomes possible to compare the collected colors to a set of references.
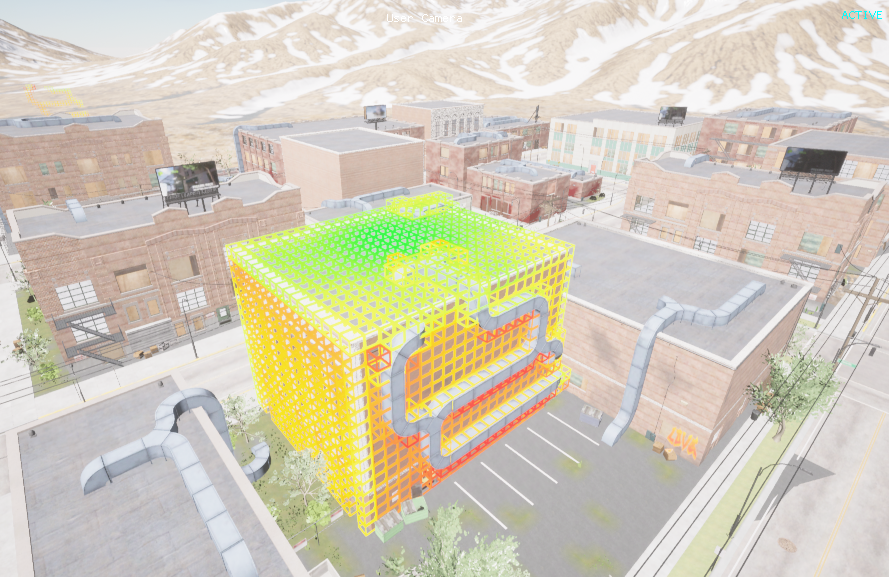
Another useful feature is the option show-3Dgrid-colors. It starts the UE4
application normally but places highlighted and colored grid units according to
the provided yaml file:
parrot-ue4-<app> -stencil-file=<input.stencil> -show-3Dgrid-colors=<input.colors>,<threshold>[+]
The file <input.colors> is an array of arrays. It lists up all colors/grid units to display. To each color is attached a “weight”. It is formatted as follows:
- - 231,250,17,255
  - 116
- - 231,252,17,255
  - 116
- - 231,255,17,255
  - 116
- - 230,254,17,255
  - 115
The color gradient from red to green is used. The more a given weight is close to 0, the more its grid unit will appear in red color. The more a given weight is close to the specified <threshold>, the more the grid unit will tend to the green. If the weight is higher than the threshold:
the grid unit is displayed in green color if a “+” character is appended to the threshold
the grid unit is not displayed otherwise.